


Nauč sa čítať trh tak, ako ho čítajú profíci.
Deepora ťa vedie od základov po orderflow — a AI mentor postavený na overených orderflow materiáloch dohliada na všetko, čo robíš. Kurikulum A→Z, testy a denník, ktorý sa píše sám.
Účet zadarmo za minútu, bez karty — dá ti prehľad appky a nákup balíka. Denník si vyskúšaš hneď v živom deme aj bez účtu; akadémia, indikátory a AI mentor sú súčasťou plateného balíka.
Sleduj nás na Instagrame
Na čom práve pracujeme
Na čom teraz reálne pracujeme — a čo si vieš kúpiť hneď. Prepína sa to samo; šípkami alebo záložkou pod tým si prepneš, čo chceš vidieť.
Staviame most medzi grafom, AI a overeným rozumom
Medziappka drží živý stav trhu, AI nad ním rozmýšľa a vault si pamätá, ktorá téza obstála a ktorá nie. Staviame to otvorene — čo beží, čo je rozrobené a čo nesľubujeme.
Hub: jeden živý stav
Dáta z platformy, orderflow a otvorené pozície na jednom mieste, aby stratégia aj AI čítali to isté.
AI nad živým stavom
Konektor, cez ktorý si AI vypýta úrovne, profily a kontext, máme postavený — teraz je pozastavený a vrátime sa k nemu.
Rozum, ktorý sa dá overiť
Každá téza je poznámka so stavom: obstála, padla, nerozhodnuté. Nie citát z kurzu, ale tvrdenie, ktoré prežilo dáta.
Človek na vypínači
Slučka smie navrhovať a zapisovať. Zbrojenie a stopku držíš ty — a na tom sa nič nemení.
 Denník v Obsidiane
Takto vyzerá orderflow, keď mu rozumieš
Päť scén, päť indikátorov. Prepínajú sa samé — alebo si preklikaj, čo ťa zaujíma.
Jedna zelená sviečka. Skrýva celý súboj kupcov a predajcov.
Odscrolluj a rozober ju vrstvu po vrstve — od živých tickov cez orderflow footprint až po kumulatívnu deltu.
- 01
Sviečka ožíva
Každý tick je jeden obchod. Zelené nákupy, fialové predaje — spolu v reálnom čase skladajú telo sviečky.
- 02
Súboj býkov a medveďov
Kupci tlačia hore, predajcovia dole. Kde jedna strana pohltí druhú bez pohybu ceny, vzniká absorpcia.
- 03
Footprint odhalený
Vnútro sviečky: koľko sa kúpilo a predalo na každej cene. Delta a POC ukážu, kto mal navrch.
- 04
Prelet dovnútra
Vlet priamo do jadra pohybu — objem sa rozletí okolo teba a uvidíš štruktúru, ktorú bežný graf schová.
- 05
Delta naprieč trhom
Sviečky vedľa seba a nad nimi kumulatívna delta — nitka, ktorá odhalí, kam naozaj tečú peniaze.
- 06
A takto to vyzerá naživo
Presne toto ti Deepora kreslí v reálnom čase — a AI mentor ti povie, čo to znamená.
Tvoj denník sa píše sám. AI mentor ho rozoberie.
Obchoduješ v NinjaTraderi, náš indikátor pošle každý uzavretý obchod aj s orderflow dátami rovno do denníka. Ty nenapíšeš ani riadok.
- Auto-import z NinjaTraderuKaždý obchod aj s tickami (bid/ask, delta, big trades) je v denníku sekundu po zavretí.
- Nula manuálneho písaniaŽiadne prepisovanie screenshotov ani excelu. Ušetríš hodiny a nič nezabudneš zapísať.
- AI rozbor + vzoryAI mentor ti obchod rozoberie a ML odhalí opakujúce sa chyby — revenge trading, over-trading.
Pekný vstup na absorpcii pri supporte — počkal si si na potvrdenie delty. Cieľ si ale zavrel priskoro; nabudúce nechaj bežať do ďalšej likvidity.
Denník, ktorý za teba počíta aj myslí
Obchod skončí v NinjaTraderi a o sekundu je v denníku — s krivkou účtu, kalendárom, rezmi výkonu a rozborom, ktorý ti povie, čo si spravil zle.
Skutočné screenshoty z bežiacej appky. Žiadne mockupy ani Figma vizualizácie.
Otvoriť živé demo denníkaFunkcia za funkciou
Každý obrázok nižšie je screenshot z bežiacej appky. Ku každému jedna veta, čo ti to dá — a jedna, prečo to inde nenájdeš.
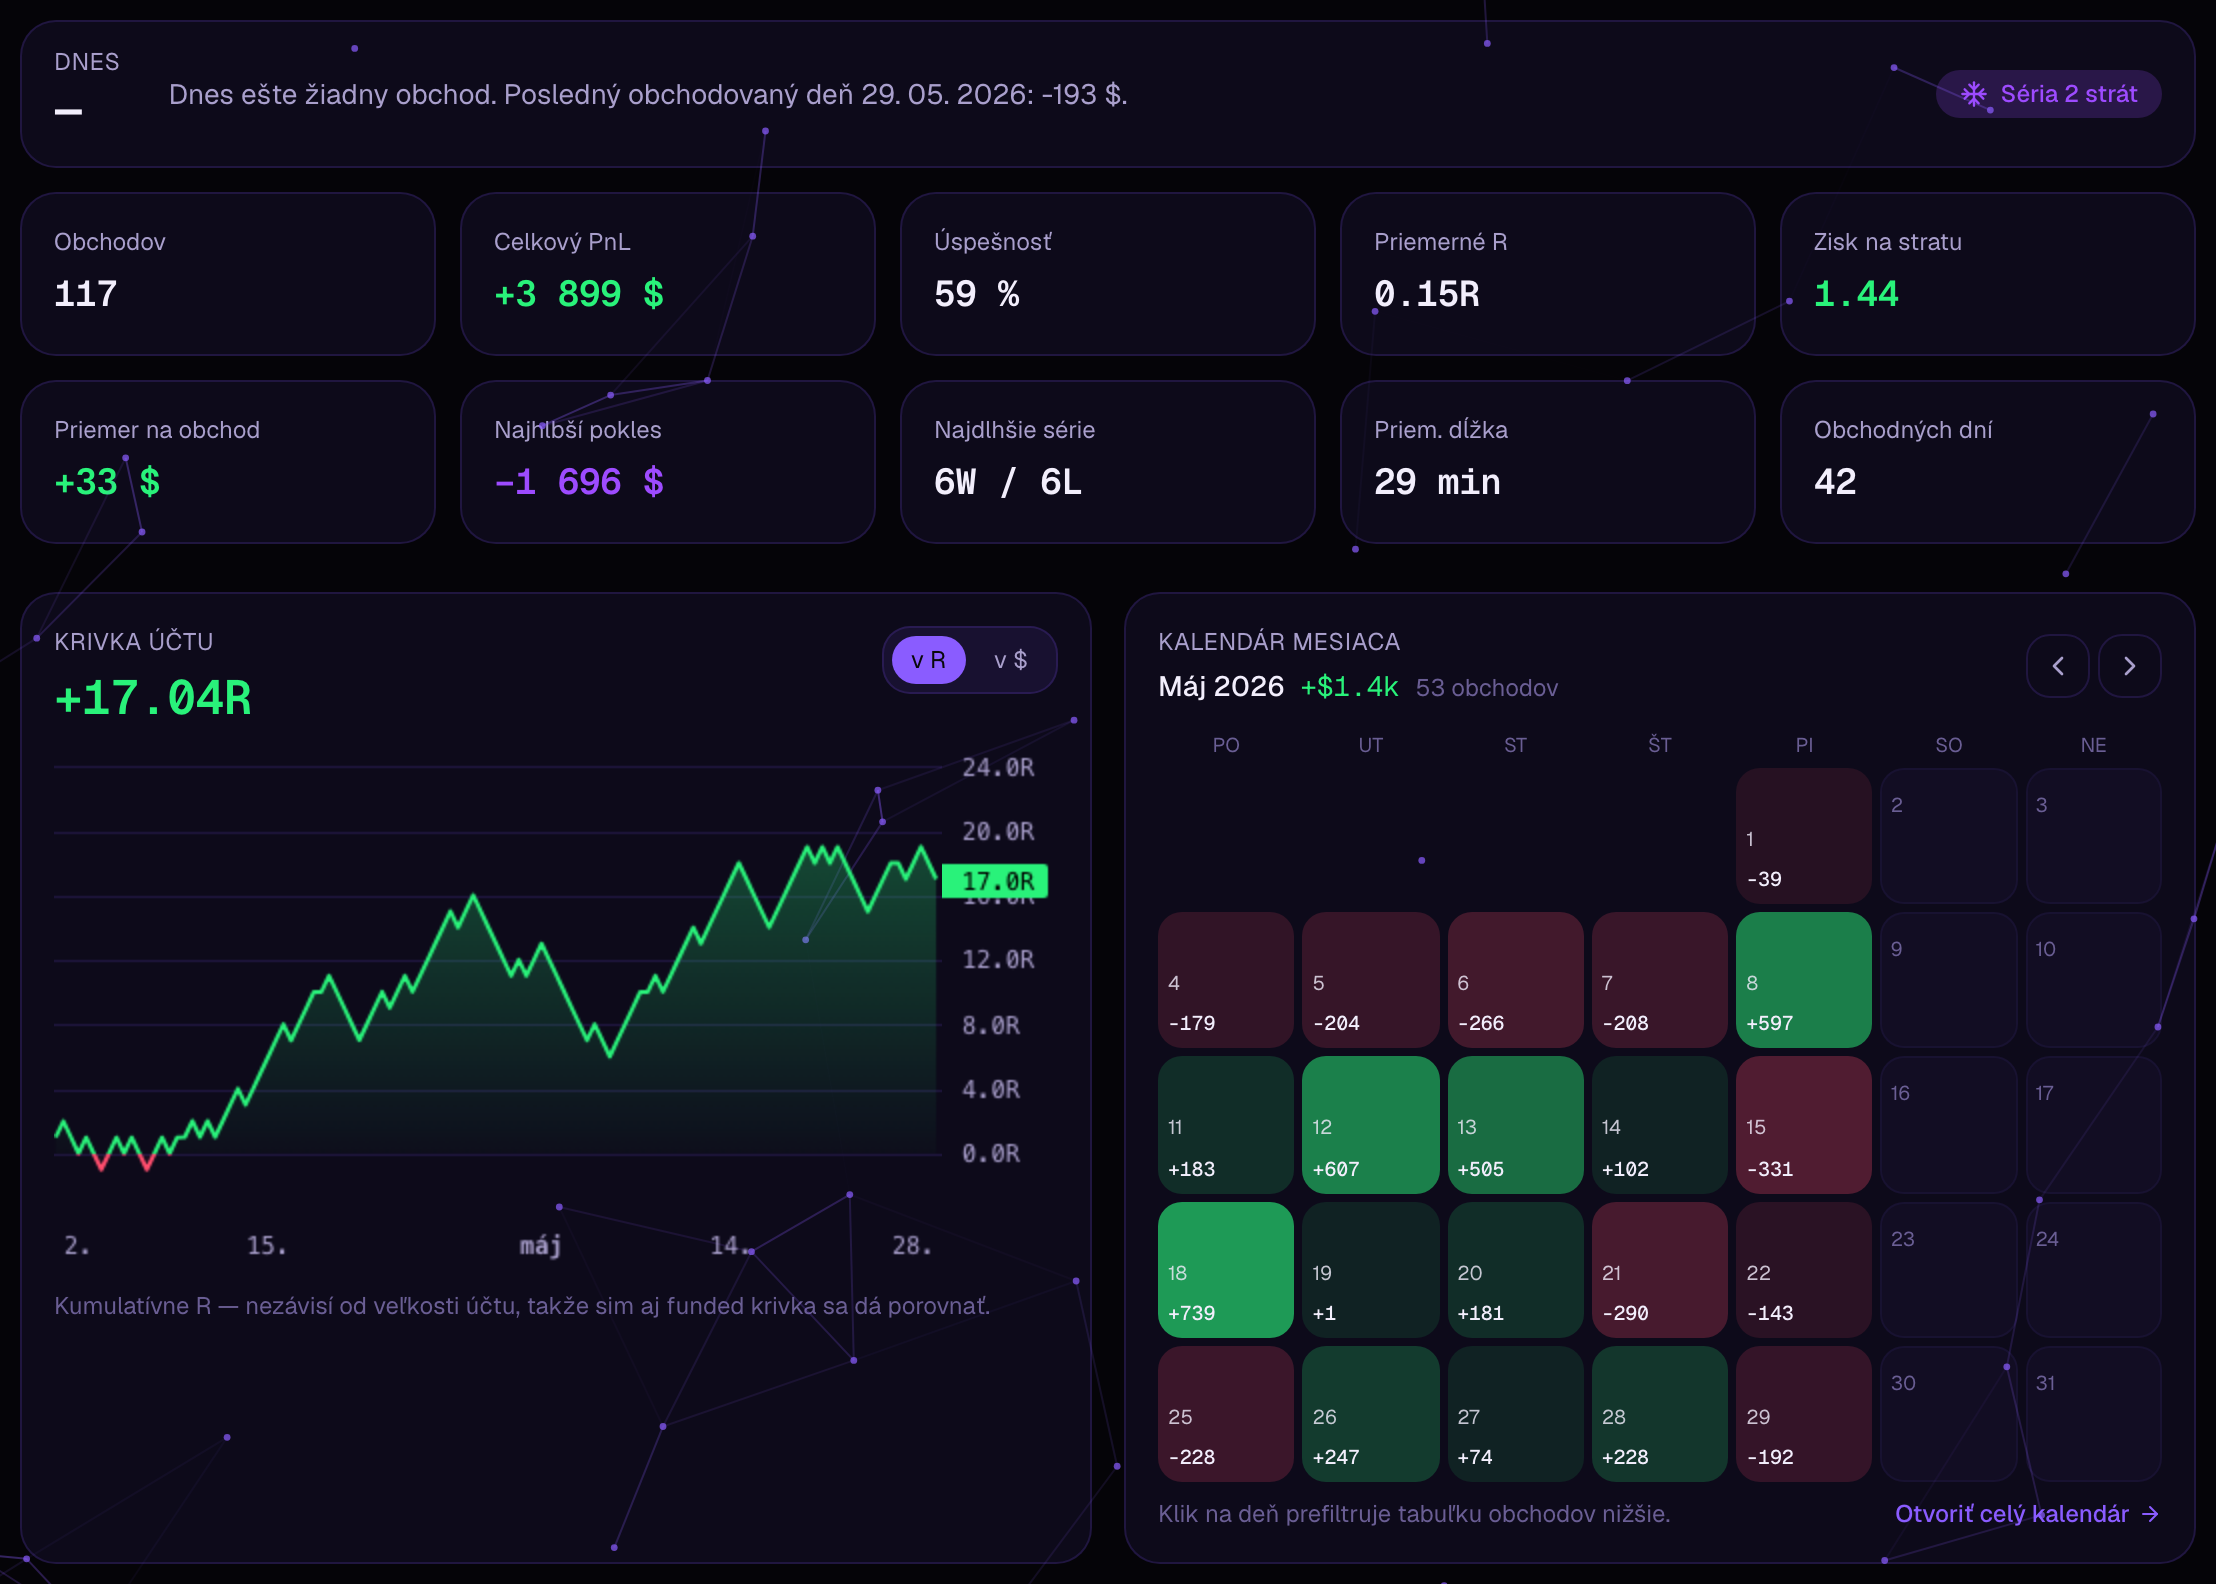
Krivka účtu, kalendár a KPI na jednej obrazovke
Otvoríš denník a do troch sekúnd vieš, či ideš hore, ktorý deň ťa zabil a či ti rastie disciplína alebo len šťastie.
Krivka je aj v R, nie len v dolároch — sim, challenge a funded účet sa tak dajú porovnať medzi sebou.
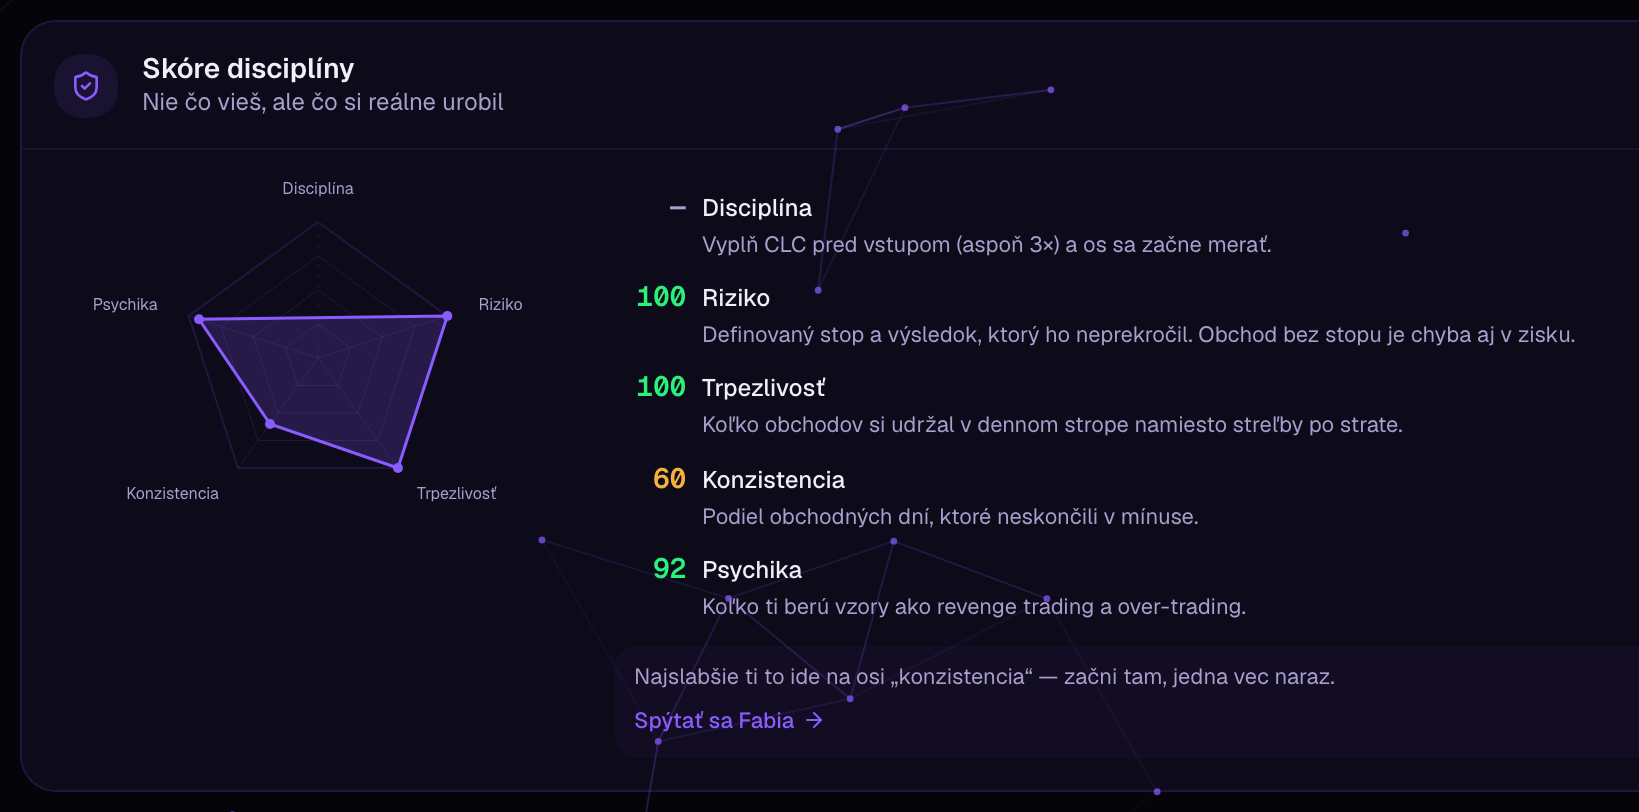
Skóre disciplíny z dát, nie z ankety
Päť osí toho, čo si REÁLNE urobil: či si vyplnil checklist, či si mal stop, koľko obchodov si za deň natlačil, či si stabilný.
Os, na ktorú nemáme dáta, ostane prázdna a prerušovaná. Skóre si nikdy nedomýšľa číslo, aby graf vyzeral pekne.
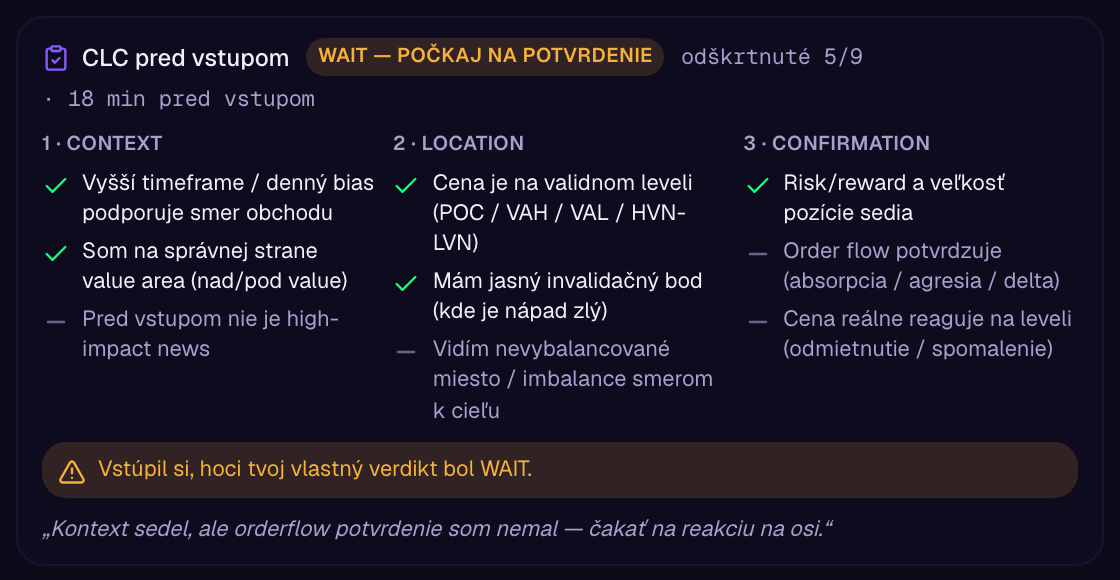
Checklist pred vstupom priamo pri obchode
Pri každom obchode vidíš, čo si si odškrtol PRED vstupom — a či si potom vstúpil proti vlastnému verdiktu.
Checklist sa k obchodu priradí sám podľa času, smeru a inštrumentu. A odmenené porušenie pravidiel appka pomenuje nahlas — aj keď obchod zarobil.
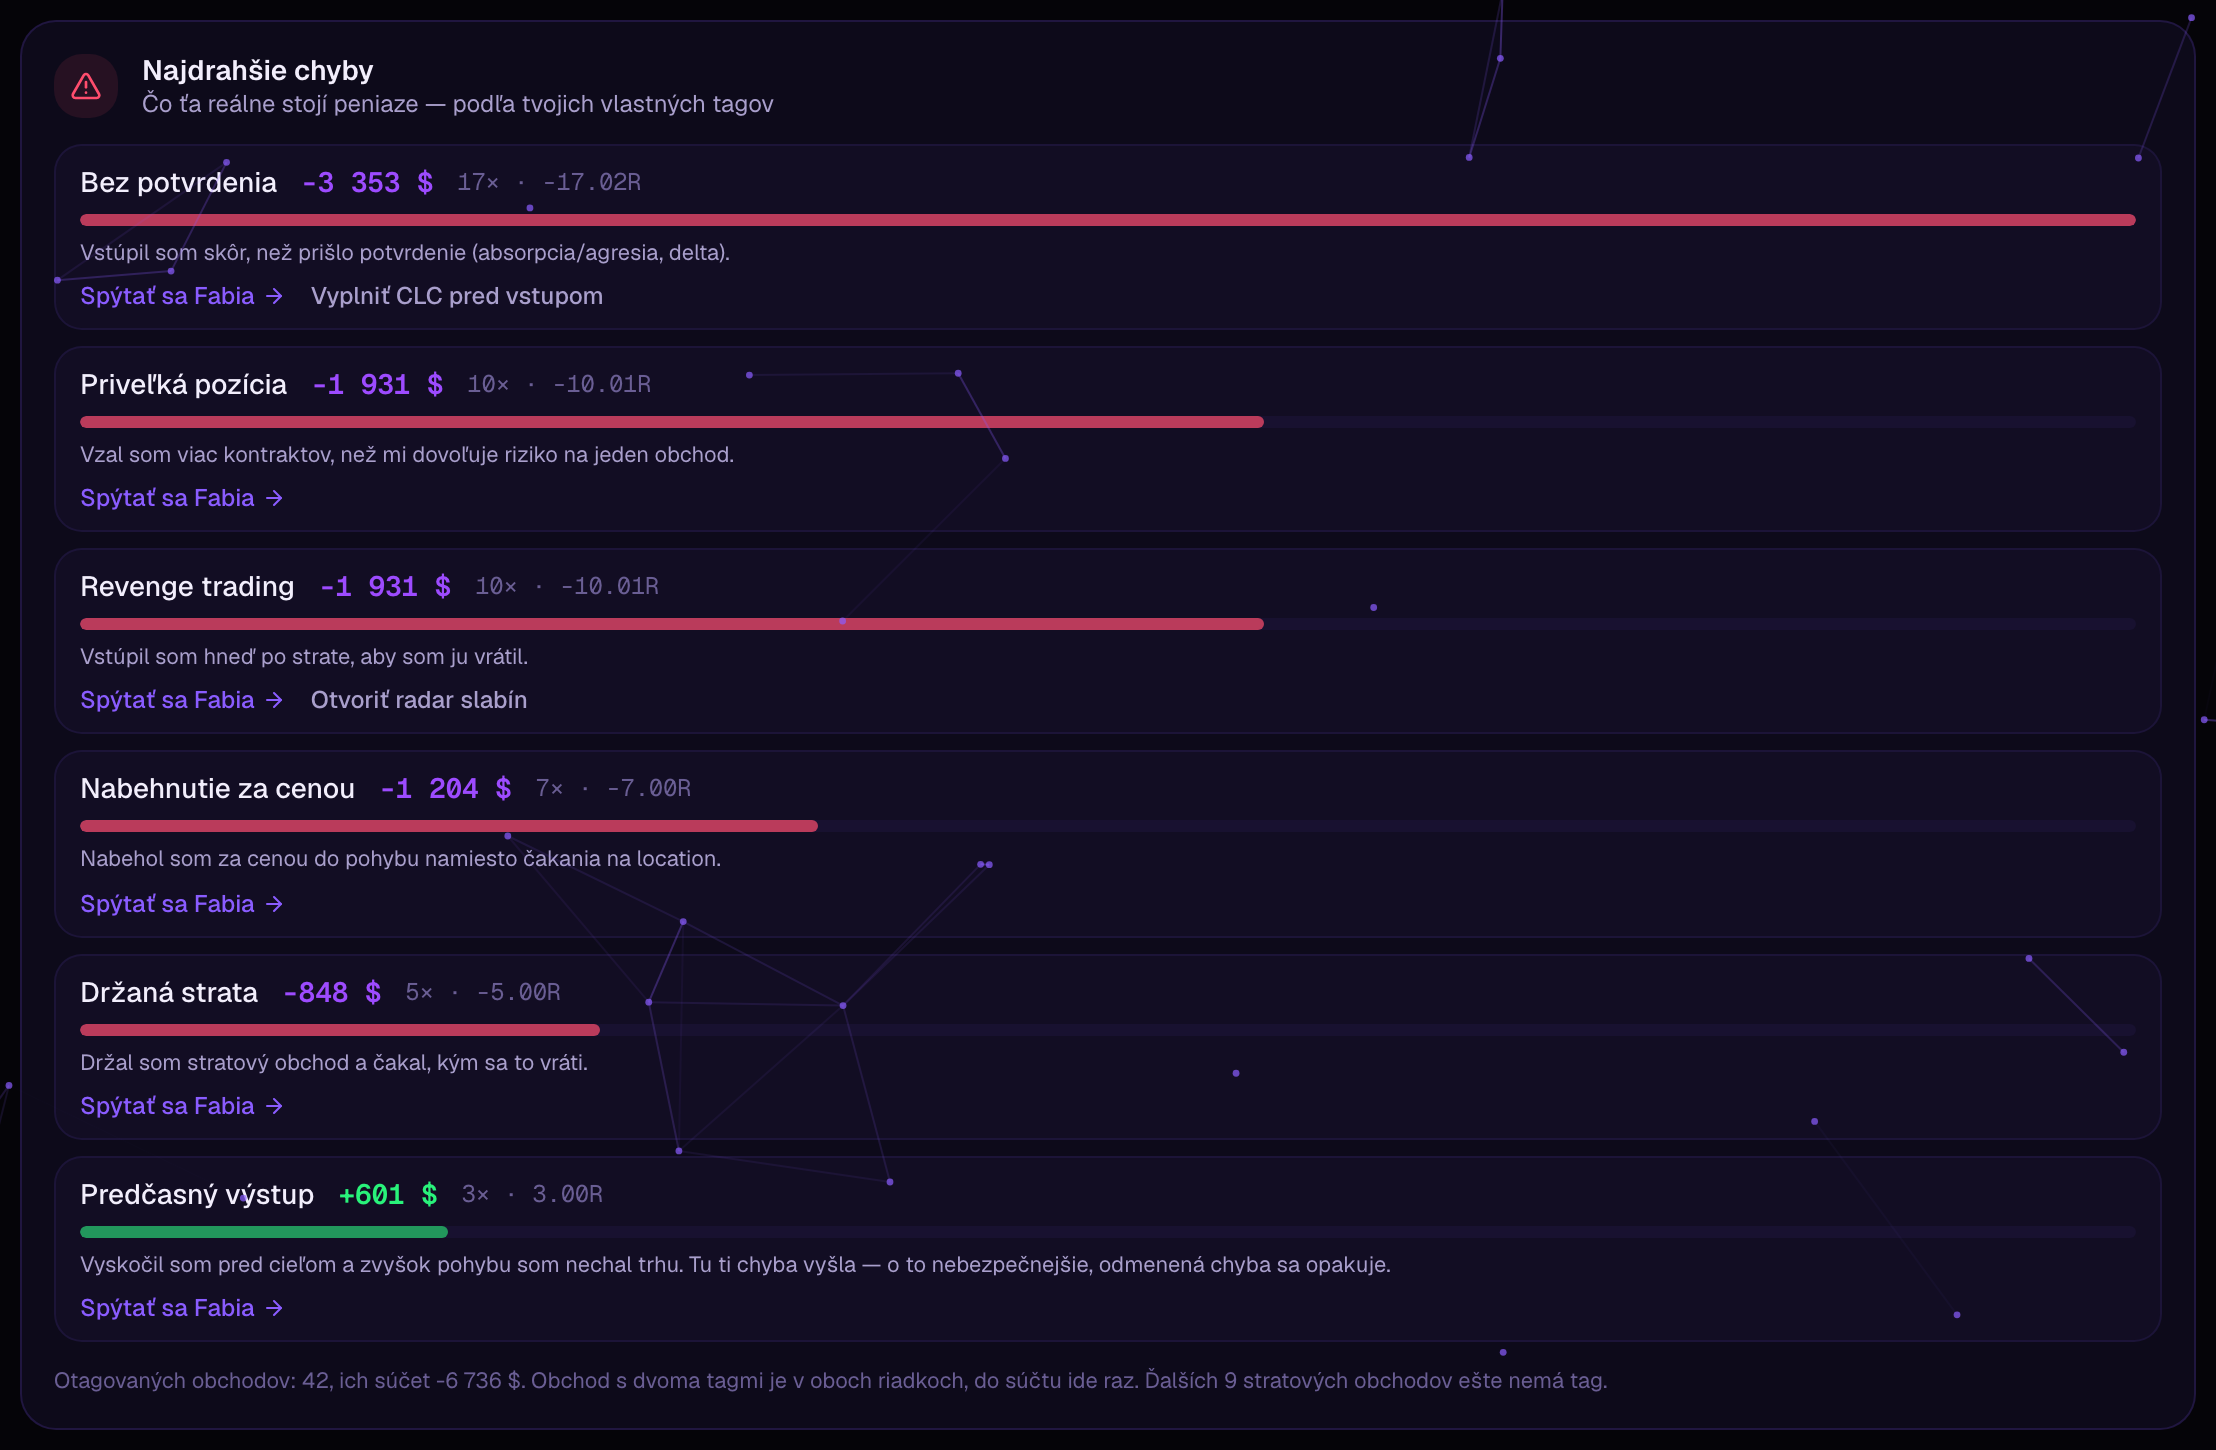
Najdrahšie chyby zoradené podľa peňazí
Pri obchode klikneš, čo sa pokazilo. Denník ti z toho spočíta, ktorý zlozvyk ťa stojí najviac — nie ktorý robíš najčastejšie.
Chyby sú pomenované, nie voľný text: dvanásť konkrétnych vecí v štyroch fázach obchodu. Opakovaná a drahá chyba si sama pridá lekciu do študijného plánu.
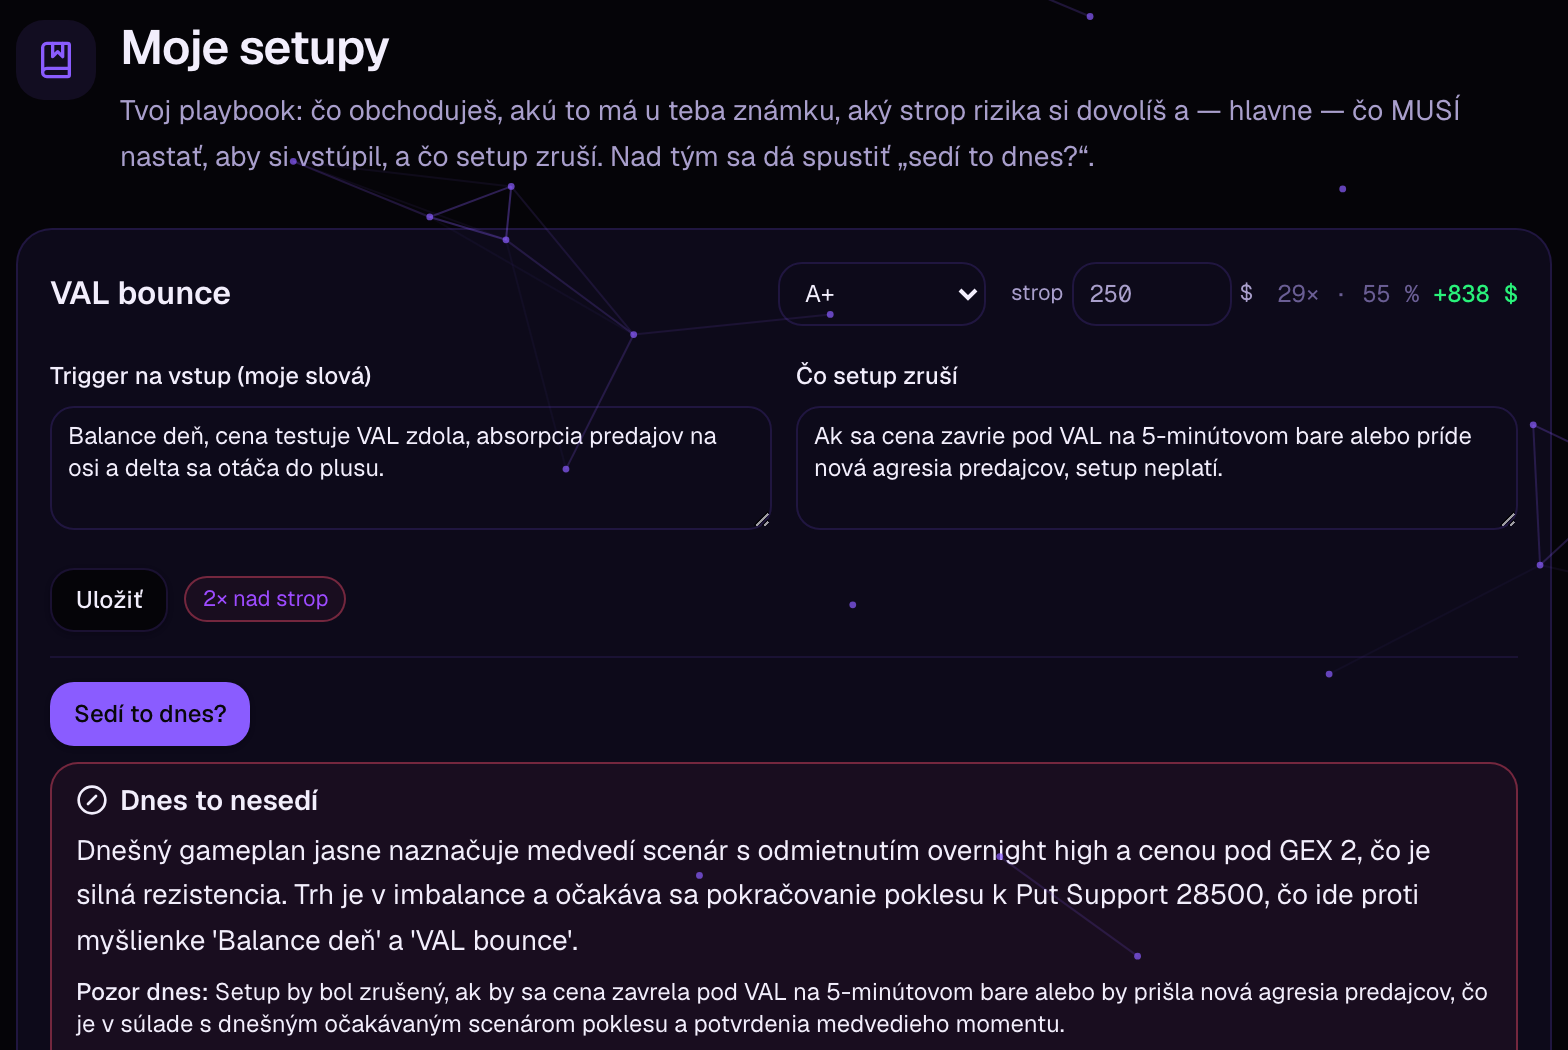
Tvoje setupy, tvoje pravidlá, jedna otázka
Známka, strop rizika a pravidlá vlastnými slovami. Potom sa spýtaš „sedí to dnes?“ a dostaneš odpoveď z dnešných úrovní a správ.
Neporovnáva sa screenshot, ale tvoje napísané pravidlá proti reálnemu kontextu dňa. Bez pravidiel sa AI nespustí a chýbajúci kontext si nedomýšľa.
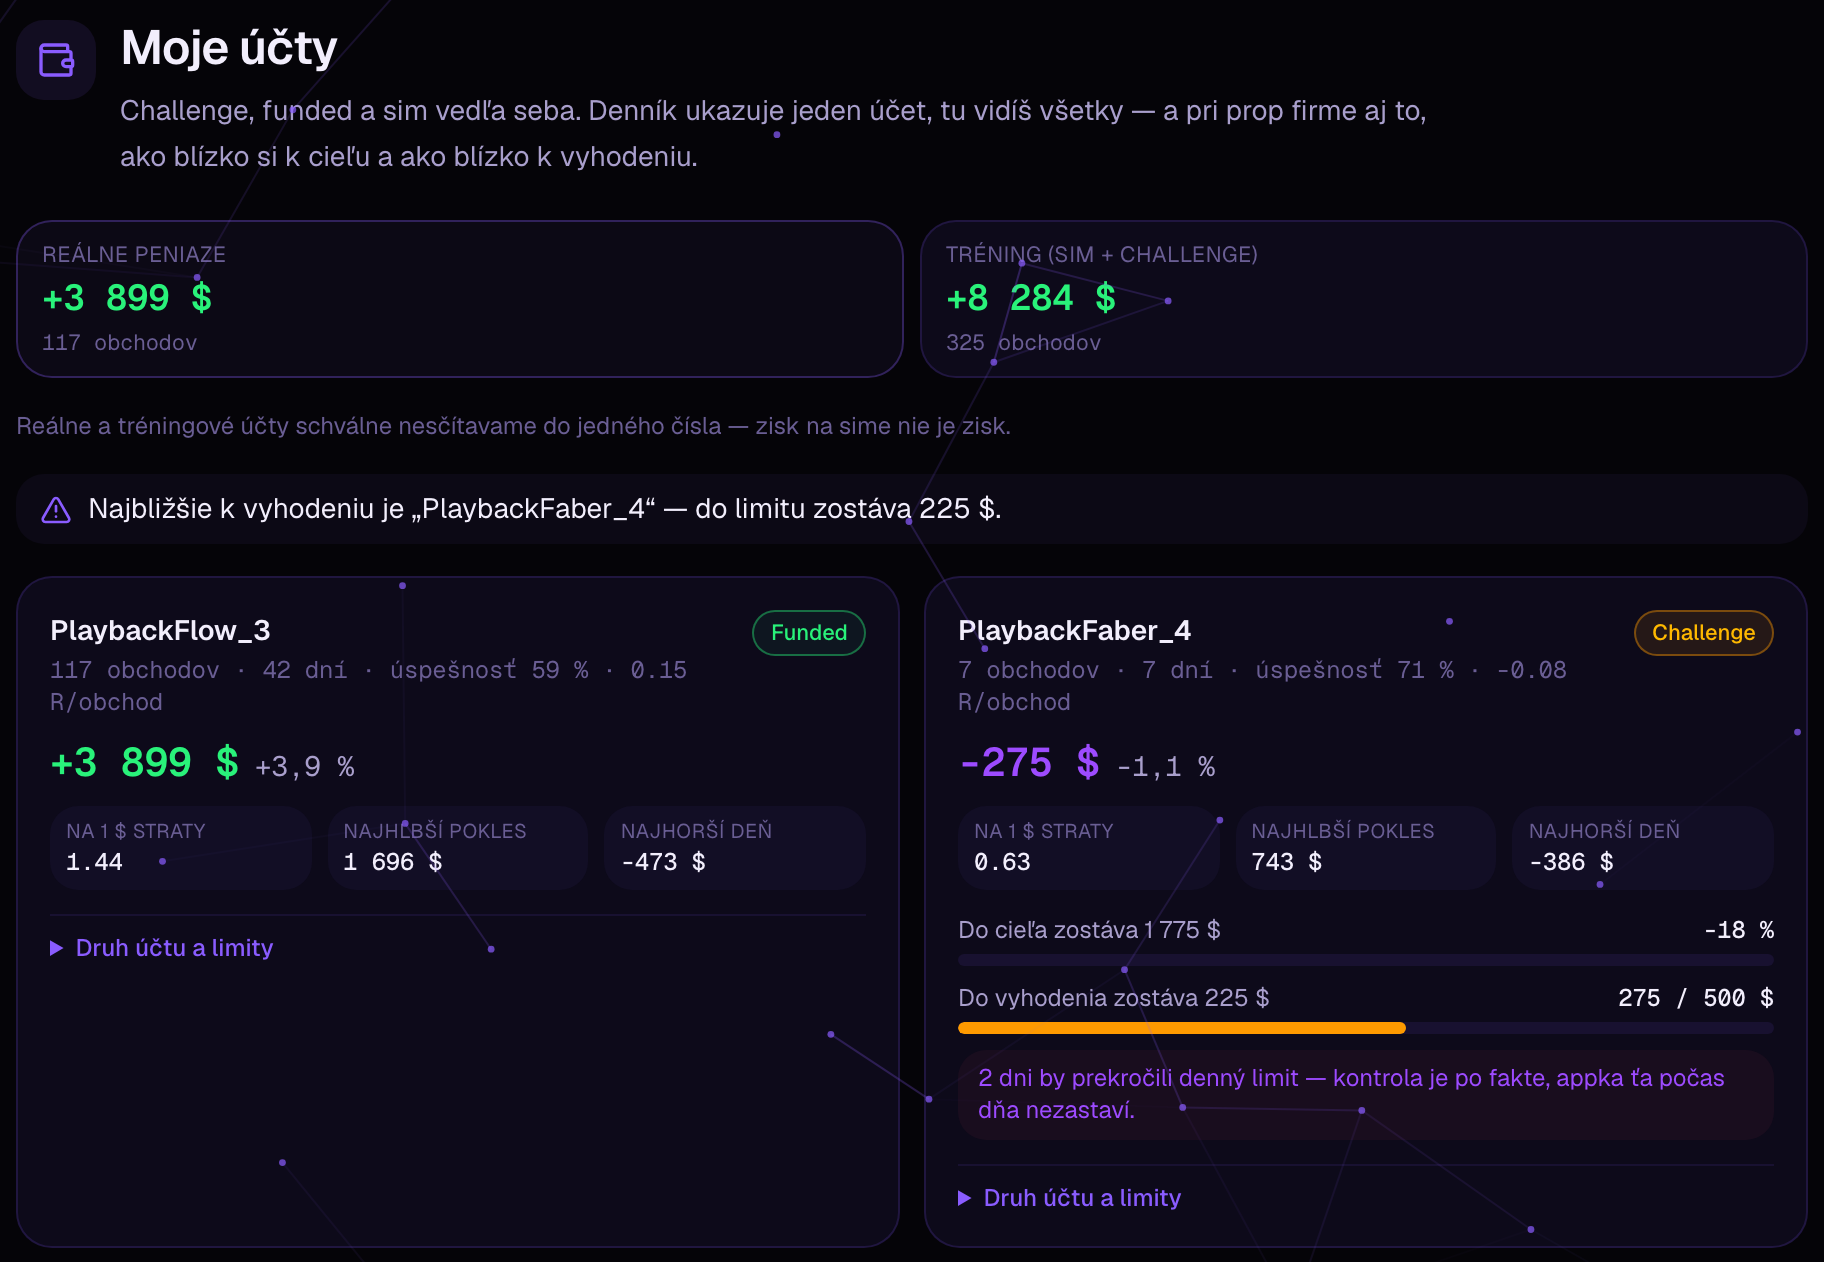
Challenge, funded a sim vedľa seba
Zadáš cieľ a limity prop firmy a vidíš, koľko chýba do cieľa, koľko zostáva do vyhodenia a ktoré dni by prekročili denný limit.
Zisk na sime a zisk na reálnych peniazoch sa nikdy nesčítajú do jedného čísla.
- Krivka účtu v R aj v dolárochKumulatívne R nezávisí od veľkosti účtu, takže sim, challenge a funded krivku porovnáš medzi sebou.
- Mesiac ako mriežka dníZelené a červené dni na prvý pohľad. Klik na deň prefiltruje obchody a hneď vidíš, čo sa vtedy stalo.
- Kde presne zarábaš a kde platíšRezy podľa session, setupu, dňa v týždni, hodiny vstupu, inštrumentu aj nálady. Session a hodinu appka dopočíta sama.
- Rozbor v troch blokochČo fungovalo, čo zlyhalo, čo urobiť inak — nad reálnym tickovým orderflow, nie nad screenshotom, a s odkazom na konkrétnu lekciu.
„Tvoje longy v prvej hodine po otvorení New Yorku sú tvoj najsilnejší setup. Peniaze ale vraciaš popoludní, keď dotláčaš pozíciu do obedného pásma — v ňom máš 12 obchodov a mínus 640 dolárov. Zavri obchodný deň o 12:00 ET a mesiac ti sedne do plusu.“
Appka vie, čo si si sľúbil — a ozve sa, keď to porušíš
Denník ti ukáže, čo si zarobil. Toto ti ukáže, či si to zarobil podľa svojich pravidiel, alebo napriek nim. Šesť vecí, ktoré appka kontroluje za teba.
Tvoj obchodný plán, nie náš
Pravidlá, riziko a podmienky vstupu si zapíšeš raz. Appka ich potom používa ako meradlo pri každom obchode.
/playbookVlastné setupy, ktoré sa dajú overiť
Nadefinuješ si setup so znakmi, podľa ktorých ho spoznáš. Každý obchod sa k nemu priradí a vidíš, ktorý ti reálne zarába.
/journalObchody sa načítajú samy
Indikátor pošle obchod aj s orderflowom na úrovni tickov v momente, keď zavrieš pozíciu. Nič neprepisuješ ručne.
TradeExporter → /journalAI rozbor každého obchodu
Nie či bol ziskový, ale či sedel s tvojím plánom: kde si vstúpil, čo robil orderflow a čo si podľa vlastných pravidiel spraviť nemal.
/journalDisciplína a chyby v číslach
Skóre disciplíny, opakované chyby a to, čo ťa stoja. Nie pocit — spočítané z tvojich obchodov.
/pokrok · /radarOdhalí vzorec skôr než ty
Revenge trading, over-trading, obchody tesne po správach. Keď sa vzorec objaví, appka ho pomenuje a pošle do tvojho študijného plánu.
/cas · /radarAk obchoduješ prop účet, zadáš cieľ, denný limit a maximálny drawdown — appka ti pri každom dni ukáže, ako blízko si k cieľu a ako blízko k vyhodeniu.
Všetko na jednom mieste
Od prvej sviečky po čítanie bid/ask footprintu.
AI mentor
Umelá inteligencia postavená na overených orderflow materiáloch. Dohliada na všetko, čo robíš — odpovedá 24/7, čisto podľa overenej metodiky a vždy s odkazom na zdroj.
Zistiť viac →Kurikulum A→Z
Štruktúrovaná cesta od úplných základov po pokročilý orderflow.
Testy a examiner
Over si, či rozumieš. Adaptívne otázky ťa zaradia na správny level.
Automatický AI denník
Obchody sa zapíšu samé z NinjaTraderu — AI mentor ti ich rozoberie a odhalí tvoje vzory.
Praktikum a radar
Trénuj čítanie trhu na reálnych dátach s okamžitým feedbackom.
Indikátory pre NinjaTrader
FootprintChart, BigTrades a volume profile priamo v NinjaTraderi — a denník, čo sa píše sám.
Zistiť viac →Rebríček traderov
Verejný prop-firm rebríček podľa gain % — súťaž s komunitou s účtom, ktorý si sám zvolíš.
Zistiť viac →Tri kroky k lepšiemu obchodovaniu
Uč sa
Prejdi kurikulom vlastným tempom, pýtaj sa mentora na čokoľvek.
Testuj sa
Otestuj pochopenie a nechaj sa zaradiť na správnu úroveň.
Obchoduj s feedbackom
Obchoduj v NinjaTraderi — denník sa zapíše sám a AI mentor ti dá spätnú väzbu.
Prečo nie ďalší AI denník
Bežný AI denník vidí PnL, čas a tvoju poznámku. My vidíme, čo sa dialo v knihe objednávok.
Pravý stĺpec opisuje kategóriu, nie konkrétnu firmu. Porovnávame funkcie, nie mená.
Appka sa hýbe každý týždeň
Posledné veci, ktoré pribudli. Rovnaký zoznam vidia aj prihlásení používatelia v appke.
Denník si stiahneš do Obsidianu
Pribudol plugin do Obsidianu: obchody z denníka ti stiahne do poznámok na vlastný disk a nakreslí nad nimi dashboard. Stiahnutie aj návod krok za krokom sú v appke.
- Equity krivka, úspešnosť, kalendár po dňoch a rozpady podľa inštrumentu, setupu, hodiny alebo dňa v týždni.
- Poznámky sú obyčajné súbory u teba — čo si k obchodu dopíšeš, sync nikdy neprepíše.
Na webe si prepneš platformu a každý indikátor má vlastnú stránku
Pribudol prepínač platforiem — hneď vidíš, čo beží dnes a na čom sa robí. A namiesto jednej dlhej stránky má teraz každý indikátor vlastnú, s obrázkami, balíkom aj tým, na ktorej platforme funguje.
- Prepínač nájdeš pri cenách aj v Indikátoroch: NinjaTrader 8 beží, na ATAS-e sa pracuje, Sierra Chart je v pláne.
- Pri každom indikátore vidíš, či je Windows-only alebo pobeží aj na Macu.
ATAS verzia pobeží aj na MacBooku
NinjaTrader 8 je Windows-only, takže na Macu sa naše indikátory doteraz spustiť nedali. ATAS beží natívne aj na macOS — s ATAS verziou sa tam toolkit prvýkrát dostane.
- Na ATAS ide celý toolkit, nie výber: footprint, veľké obchody, DOM, heatmapa, objemové profily, sessions, IVB aj exportér do denníka.
- Na ATAS-e pribudnú aj veci, ktoré na NinjaTraderi spraviť nejde — icebergy, stop runy a sweepy z dát na úrovni jednotlivých príkazov.
Meraj sa s ostatnými tradermi
Verejný rebríček v štýle prop-firiem — poradie podľa zhodnotenia účtu (gain %), nie podľa náhody. Zdravá motivácia, ktorá ťa ženie ďalej.
| # | Trader | Zisk | Gain % | Veľkosť účtu |
|---|---|---|---|---|
| 4. | TapeReader 🇦🇹 AT | +24 500 $ | +24.5 % | 100 000 $ |
| 5. | LiquidityLena 🇩🇪 DE | +9 600 $ | +19.2 % | 50 000 $ |
| 6. | ScalpSensei 🇭🇺 HU | +3 675 $ | +14.7 % | 25 000 $ |
| 7. | SwingSam 🇬🇧 GB | +5 650 $ | +11.3 % | 50 000 $ |
Vyberieš si, ktorý účet súťaží
V denníku označíš jediný účet, ktorý ide na verejný rebríček. Ostatné ostávajú len tvoje — nikto ich nevidí.
Ukážkové dáta. Do rebríčka ide len účet, ktorý si sám zvolíš — zvyšok ostáva súkromný.
Zobrazené výsledky sú ilustratívne a negarantujú budúcu výkonnosť. Obchodovanie s futures nesie riziko straty kapitálu.
Chcem sa zapojiťZačni ešte dnes
Vytvor si účet, poobzeraj sa a vyber si balík, ktorý ti sadne.
Predplatné už od 59,99 €/mes — AI mentor, akadémia aj indikátory v cene.
Účet zadarmo je bez karty — dá ti prehľad appky a nákup balíka. Akadémia, indikátory a AI mentor sa odomknú balíkom.
Časté otázky
To, čo sa reálne pýtate pred kúpou.
Musím obchody prepisovať ručne?
Nie. Náš NinjaTrader indikátor pošle obchod aj s tickovým orderflow sám, hneď po zatvorení pozície. Ty dopĺňaš len poznámku, setup a náladu — a ani to nemusíš.
Potrebujem NinjaTrader?
Na automatický denník áno — sme postavení na NinjaTraderi (aj preto vidíme reálne ticky, nie iba PnL). Mentora, akadémiu, skúšanie a kvízy používaš aj bez neho.
Odkiaľ mentor berie odpovede?
Z materiálov jednej metódy — order flow podľa Fabia Valentiniho. Ku každej odpovedi ukáže zdroj, z ktorého to má, takže si to viete overiť. Keď v materiáloch odpoveď nie je, povie to.
Čo sa deje s mojimi dátami?
Obchody aj ticky sú na našom serveri v Európe a nikam sa neposielajú do reklamy ani na predaj. AI dostane len to, čo práve rozoberá — konkrétny obchod alebo súhrn tvojho denníka.
Je to po slovensky?
Áno, celá appka aj mentor sú v slovenčine aj angličtine. Prepínač je v hlavičke.
Ako začnem?
Vytvoríš si účet, vyberieš balík a stiahneš si indikátory. Prvý obchod máš v denníku v ten istý deň, keď si ich nainštaluješ.
Napíš nám
Otázka, spätná väzba alebo záujem o spoluprácu? Ozvi sa a odpíšeme ti.
Alebo nás nájdeš na Instagram